From visibility to revenue
Turn local ranking gaps into a business case
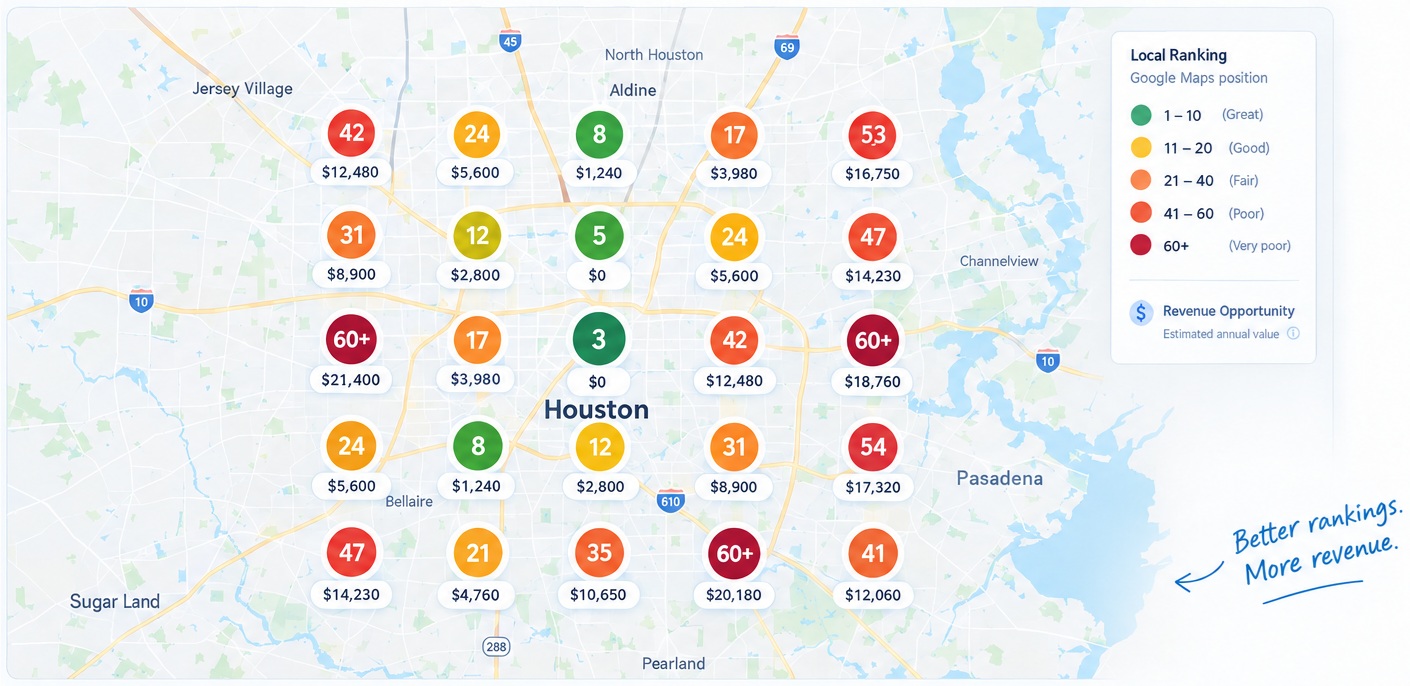
The Profit Loss Exposer combines a real Google Maps GeoGrid scan with local search demand and customer economics. It estimates how many clicks, leads, orders, and annual revenue may be missed when a business is hard to find across its service area.
It is a decision tool, not a promise of guaranteed revenue. The result gives owners a clearer view of untapped potential and gives agencies a concrete, client-friendly way to explain why visibility work matters.
Local search demand
How often people search for the selected service in the relevant local market.
GeoGrid visibility
Where the business ranks from multiple real-world search locations around its service area.
Clicks, leads, customers
A transparent impact chain converts ranking gaps into potential customer actions.
Revenue opportunity
An estimated annual value connects visibility gaps to potential customer value.
See the leak across the market
One ranking position cannot show the whole opportunity
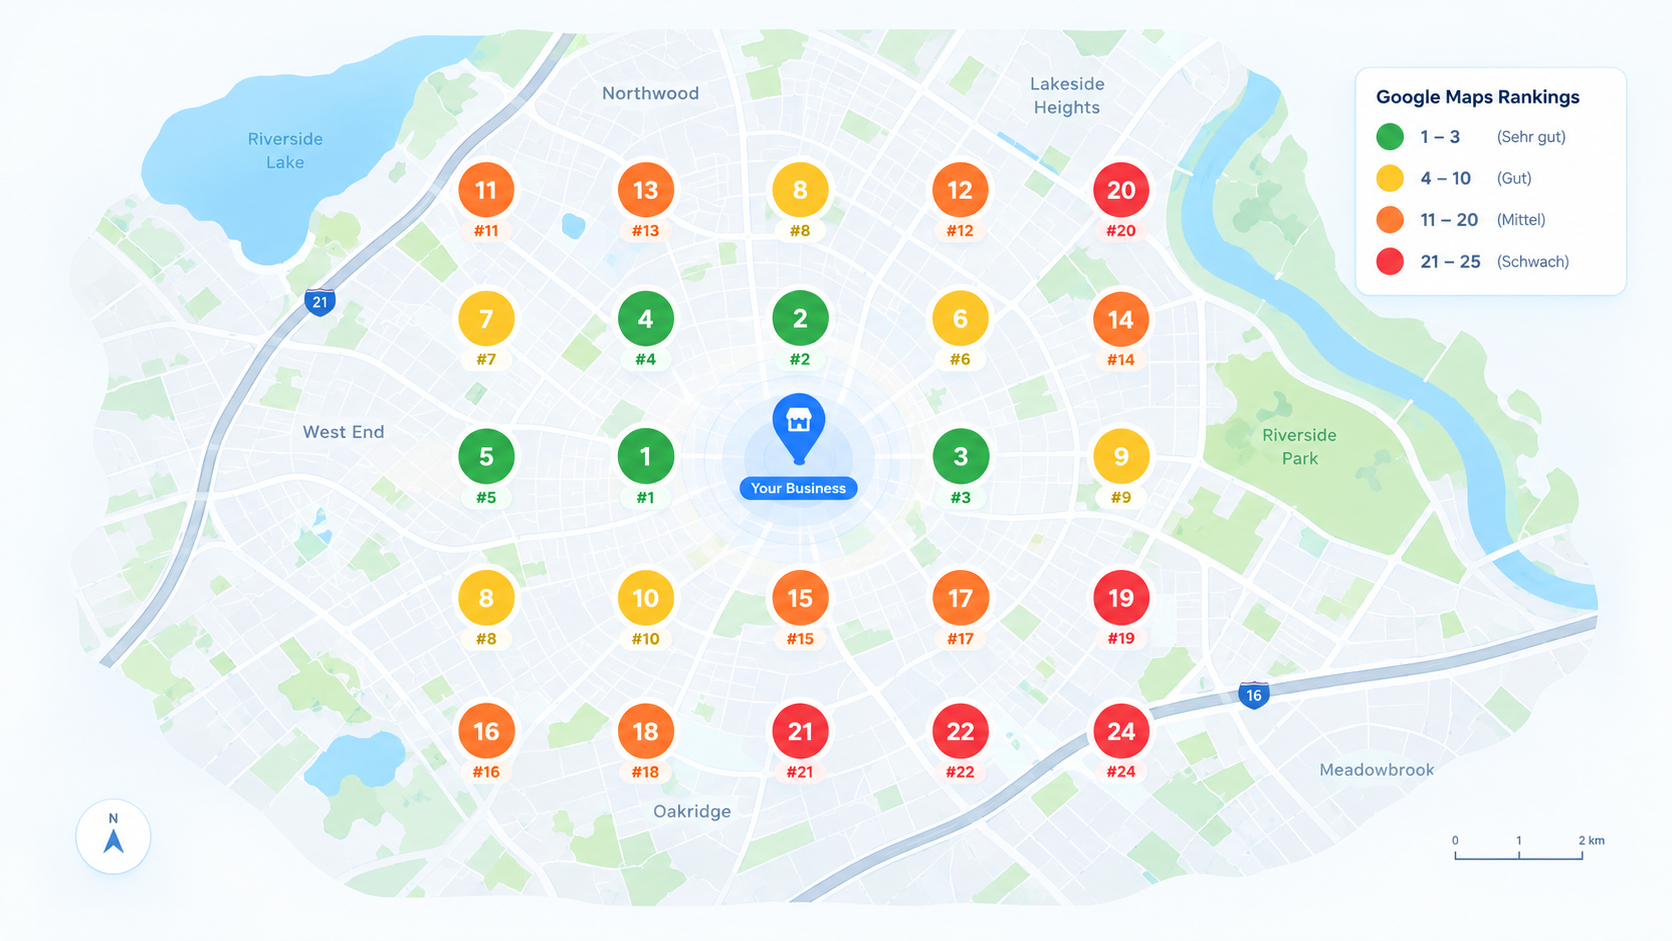
Local results change as the searcher moves. A business may rank strongly near its address but disappear several neighborhoods away. A GeoGrid makes that variation visible by checking the same keyword from a consistent grid of locations.
Grid size controls how many locations are checked. Point spacing controls the physical distance between them. Members can use the same standard square grid sizes available in regular scans, while the map preview shows the footprint before any credits are charged.
Smaller grids are useful for focused checks and compact markets.
Larger grids reveal broader visibility patterns across a service area.
Run the analysis
Four inputs. One profit-loss report.
The Exposer keeps the inputs short, but each choice has a clear role in the final report.
Choose the business
Guests find a public Google Business Profile. Members select a business already saved in their Local Rank Guru account.
Select the keyword
Members can choose a tracked keyword or an AI-generated suggestion tied to the selected business and its categories.
Set the GeoGrid
Choose grid density and point spacing. Water locations are removed before the final member credit cost is calculated.
Start and review
The report updates as scan points finish, then connects search demand and visibility to an estimated annual revenue opportunity.
For small businesses
Prioritize the searches that can create real customer value
Owners often know that visibility matters, but not whether a ranking improvement is commercially meaningful. The calculator helps answer a better question: if more nearby searchers found the business for this service, what level of order value could realistically sit behind that demand?
- Compare service keywords by potential business impact, not search volume alone.
- See where visibility weakens across the neighborhoods you want to serve.
- Use the opportunity range to guide content, profile, review, and local authority work.
For SEO agencies
Move client conversations from rank charts to commercial context
A client may not care whether a point moved from position 11 to position 6 until that change is connected to demand and customer value. The shareable report gives agencies a cautious, understandable narrative for audits, proposals, progress reviews, and opportunity prioritization.
- Explain why visibility differs across the client’s actual market.
- Connect technical local SEO work to clicks, leads, customers, and order value.
- Keep expectations credible by presenting a range rather than guaranteed revenue.
Built for useful conversations
Give owners and clients a number they can act on
Many tools stop after visualizing rankings. Generic ROI calculators often ask you to enter assumptions without measuring local visibility. Local Rank Guru combines both sides in one workflow: real GeoGrid data first, then a transparent commercial interpretation of the finished scan points.
Measured local visibility
The opportunity starts with an actual scan around the selected business, not a national rank assumption.
Visible assumptions
Keyword, local demand, conversion assumptions, close rate, and average order value remain understandable and adjustable.
One shareable story
The report links ranking coverage to commercial impact without presenting the result as guaranteed lost revenue.
Reading the result responsibly
Use the opportunity as a decision aid, not a promise
The final number is most useful for comparison. Run different service keywords, review how the visibility pattern changes, and test a realistic average order value. A higher estimate can identify a stronger priority, but execution, competition, seasonality, website conversion, call handling, capacity, and many other factors still affect the revenue a business ultimately earns.
The report presents a base estimate of potential revenue left on the table, not a guaranteed loss. The goal is a clearer business conversation: where local visibility is weak, what demand may be available, and which improvement opportunity deserves attention first.